Discrete vs. Continuous RVs (Random Variables)
A discrete RV has a countable number of possible outcomes
number of students present
number of red marbles in a jar
number of heads when flipping three coins
students' grade level
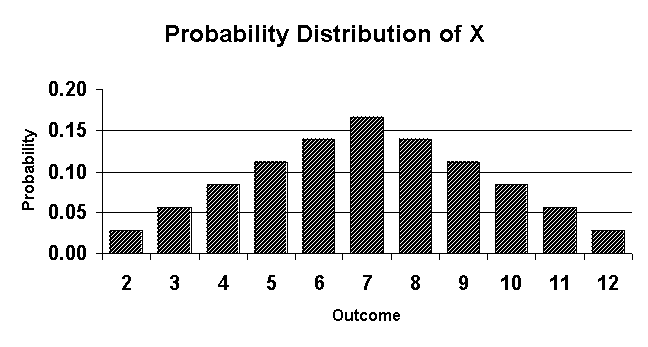
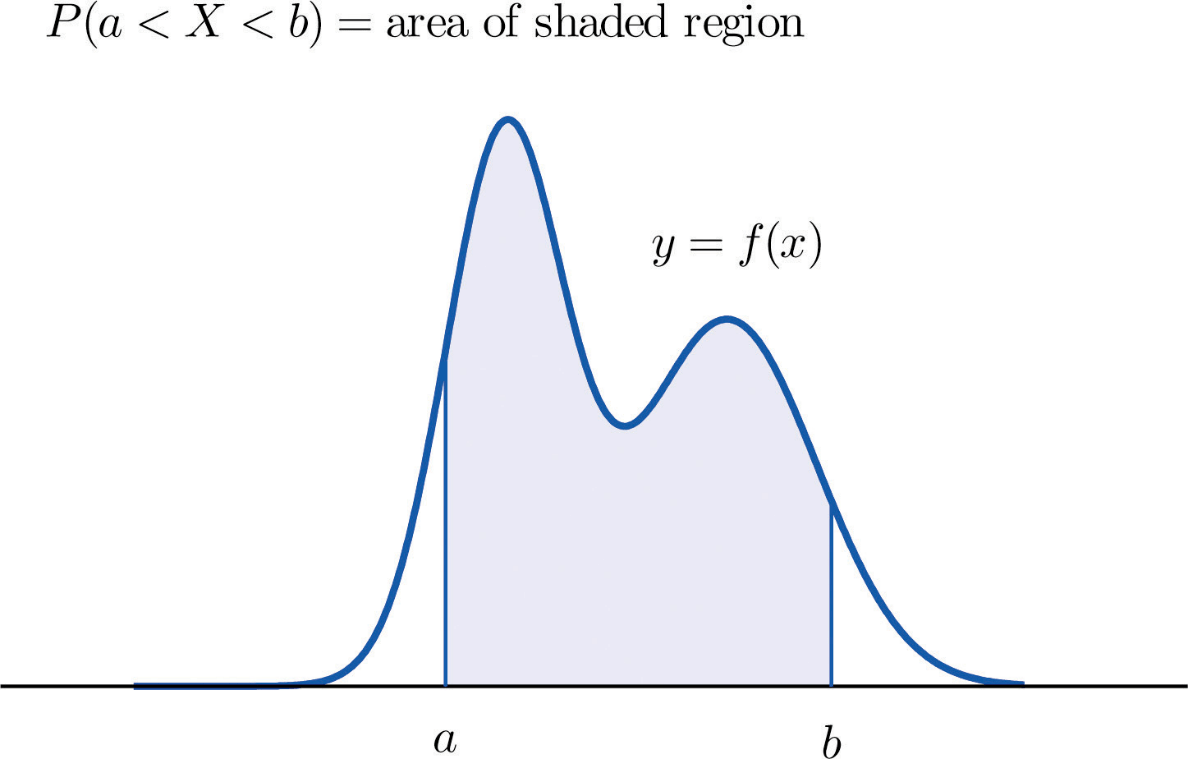
A continuous RV can take any values in an interval of numbers
height of students in class
weight of students in class
time it takes to get to school
distance traveled between classes
Probability Distribution
The probability distribution of a discrete RV(X) list all the values possible and their probabilities
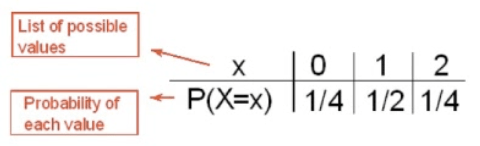
The probabilities must:
All be a number between 0 and 1
Together add up to 1
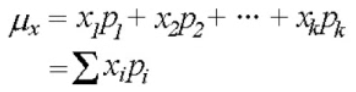
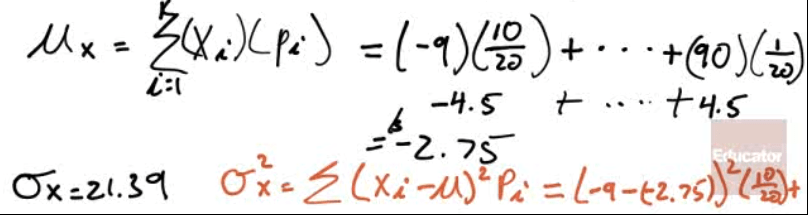
Mean = Expected Value
Formula
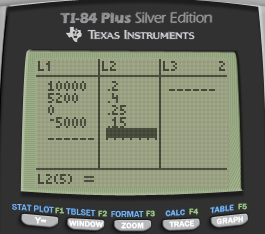
Calculator
- Type in X in L1 and P in L2
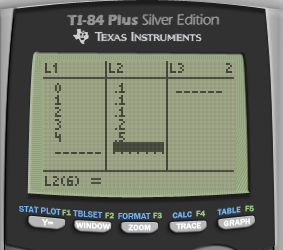
1-Var Stats L1, L2
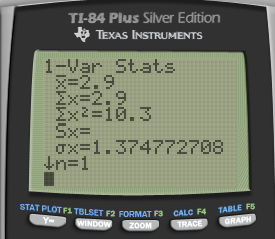
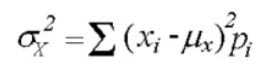
Variance = Standard Deviation
Formula
Calculator

Practice Questions
A bin contains ten $1 bills, five $2 bills, three $5 bills, one $10 bill, and one $100 bill. A person is charged $10 to select one bill. Let the random variable (X) be the amount someone wins by playing.
- Construct a probability distribution for these data.
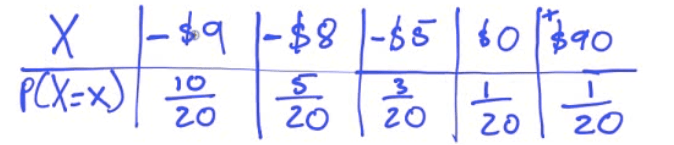
What is the mean and standard deviation of the amount of money someone can expect to win?
You work for a company and are tasked with evaluating a proposed venture. The venture stands to make a profit of $10,000 with probability 4/20, to make a profit of $5200 with probability 8/20, to break even with probability 1/4, and to lose $5000 with probability 3/20. The expected profit in dollars is? Would you recommend this venture?
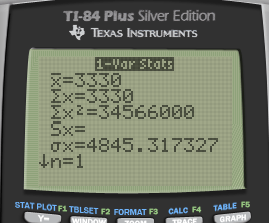
Answer: The expected profit is $3330. Recommend, because the standard deviation is not so large